Available Data
It’s not simple to estimate how much a product sells on Amazon. Unlike AliExpress, unfortunately Amazon does not disclose the number of orders for the products available on their marketplace.
Still, we can try to extrapolate the popularity of a product using the number of ratings it receives.
Let’s assume that a product with 5000 ratings sells more than a product with 1000 ratings.
But what if you want to dig further? What if you want to know sales trend of a product? Whether it’s sales are going up or down? And how it compares with other products in its category?
Well, roughly 0.5% to 1% of sales result in a review. So we can use the number of reviews a product receives as a proxy for how much it is selling.
Extrapolate Sales Trend
And the frequency with which a product receives reviews can give us an indicative sales trend.
We scraped online reviews of a few of the most popular wireless earbuds. And here’s a plot of the number of reviews received by these products per month:
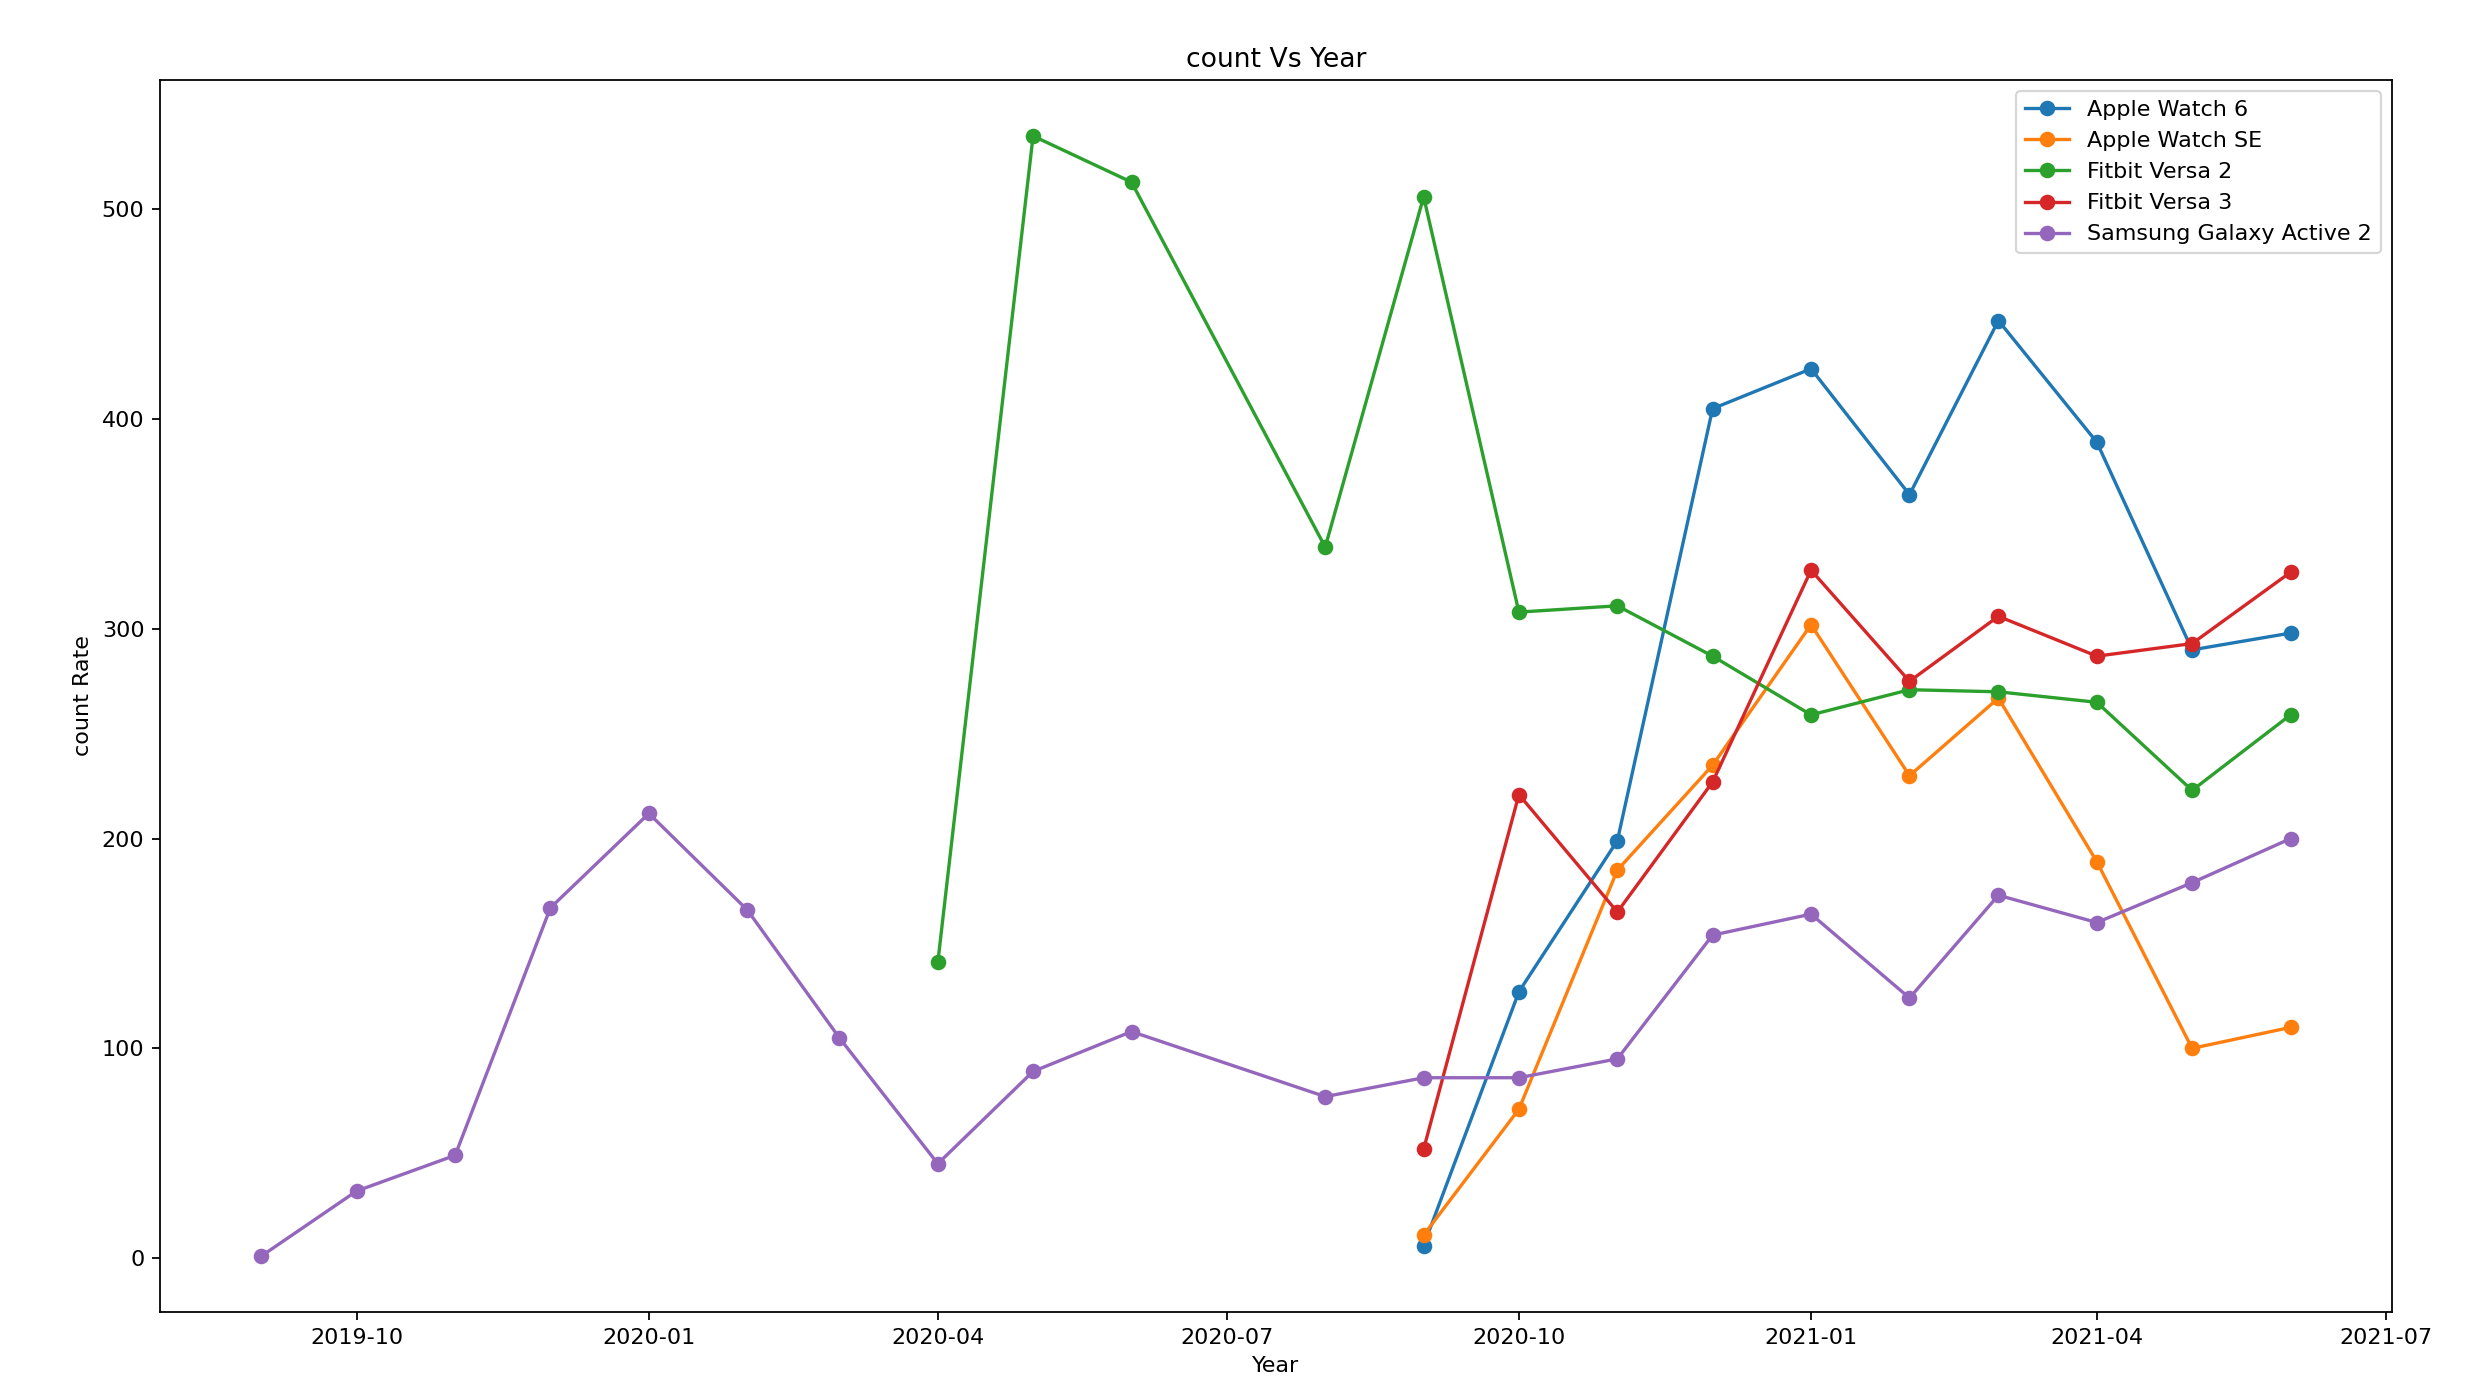
The above plot was made using about 5,000 most recent reviews of the following products: Apple Watch 6, Apple Watch SE, Fitbit Versa 2, Fitbit Versa 3, and Samsung Galaxy Active 2. We used each review’s publishing date to count the number of reviews the products received per month. The dataset used is available for download at the bottom of this post.
The above plot uses about 5,000 most recent reviews of the following products: Apple, Bose, Samsung, Jabra, and Powerbeats. We used each review’s publishing date to count the number of reviews the products received per month.
What We Learn
We can make the following observations using this plot:
- Smartwatch sales are on the rise. The curve is going upwards even for the oldest product, i.e. Samsung Galaxy Active 2.
- The launch of newer products affects their sales trend. Sales for Fitbit Versa 2 seem to have been affected by Fitbit Versa 3.
- The more expensive Apple Watch 6 is more popular than the Apple Watch SE. They both were available first on 15th September, 2020.
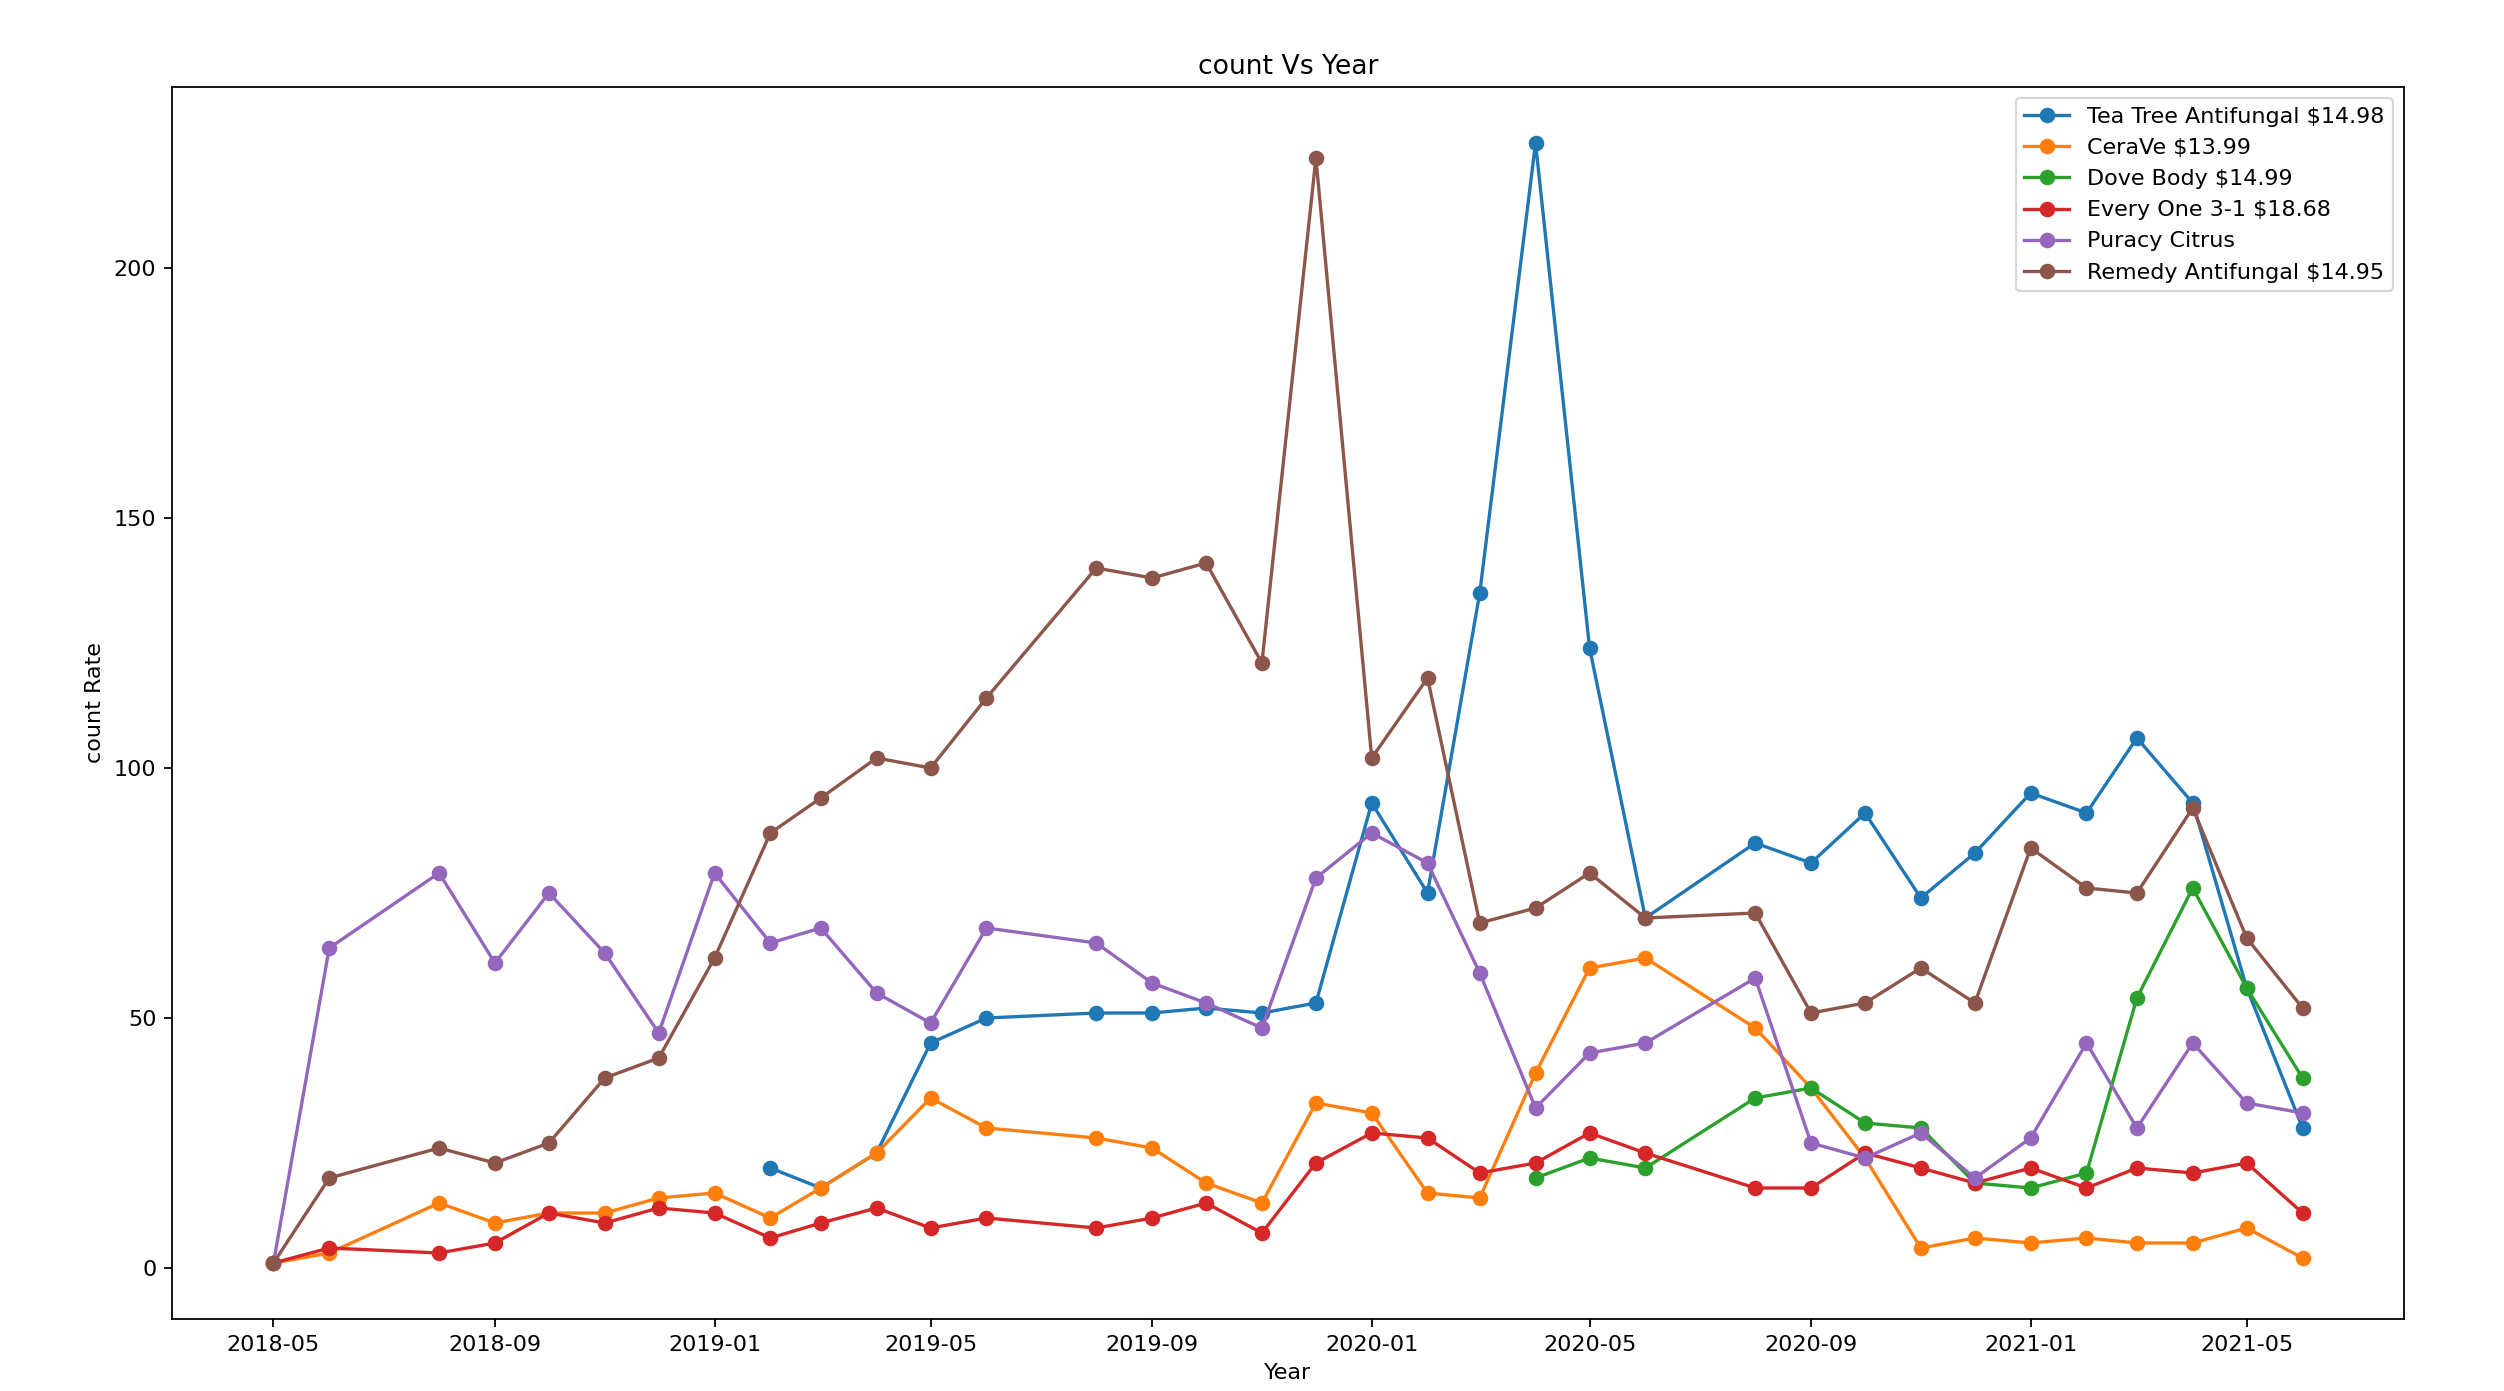
Let’s take a couple of more examples of monthly review count vs. time. This time for popular body wash products ranging between $10 and $20. Here are links to each of the products featured: Tea Tree, CeraVe, Dove, Everyone, Puracy and Remedy.
Here’s another plot with review counts for the following toilet paper products: Charmin, Cottonelle, Quilted, 7th Gen and Presto.
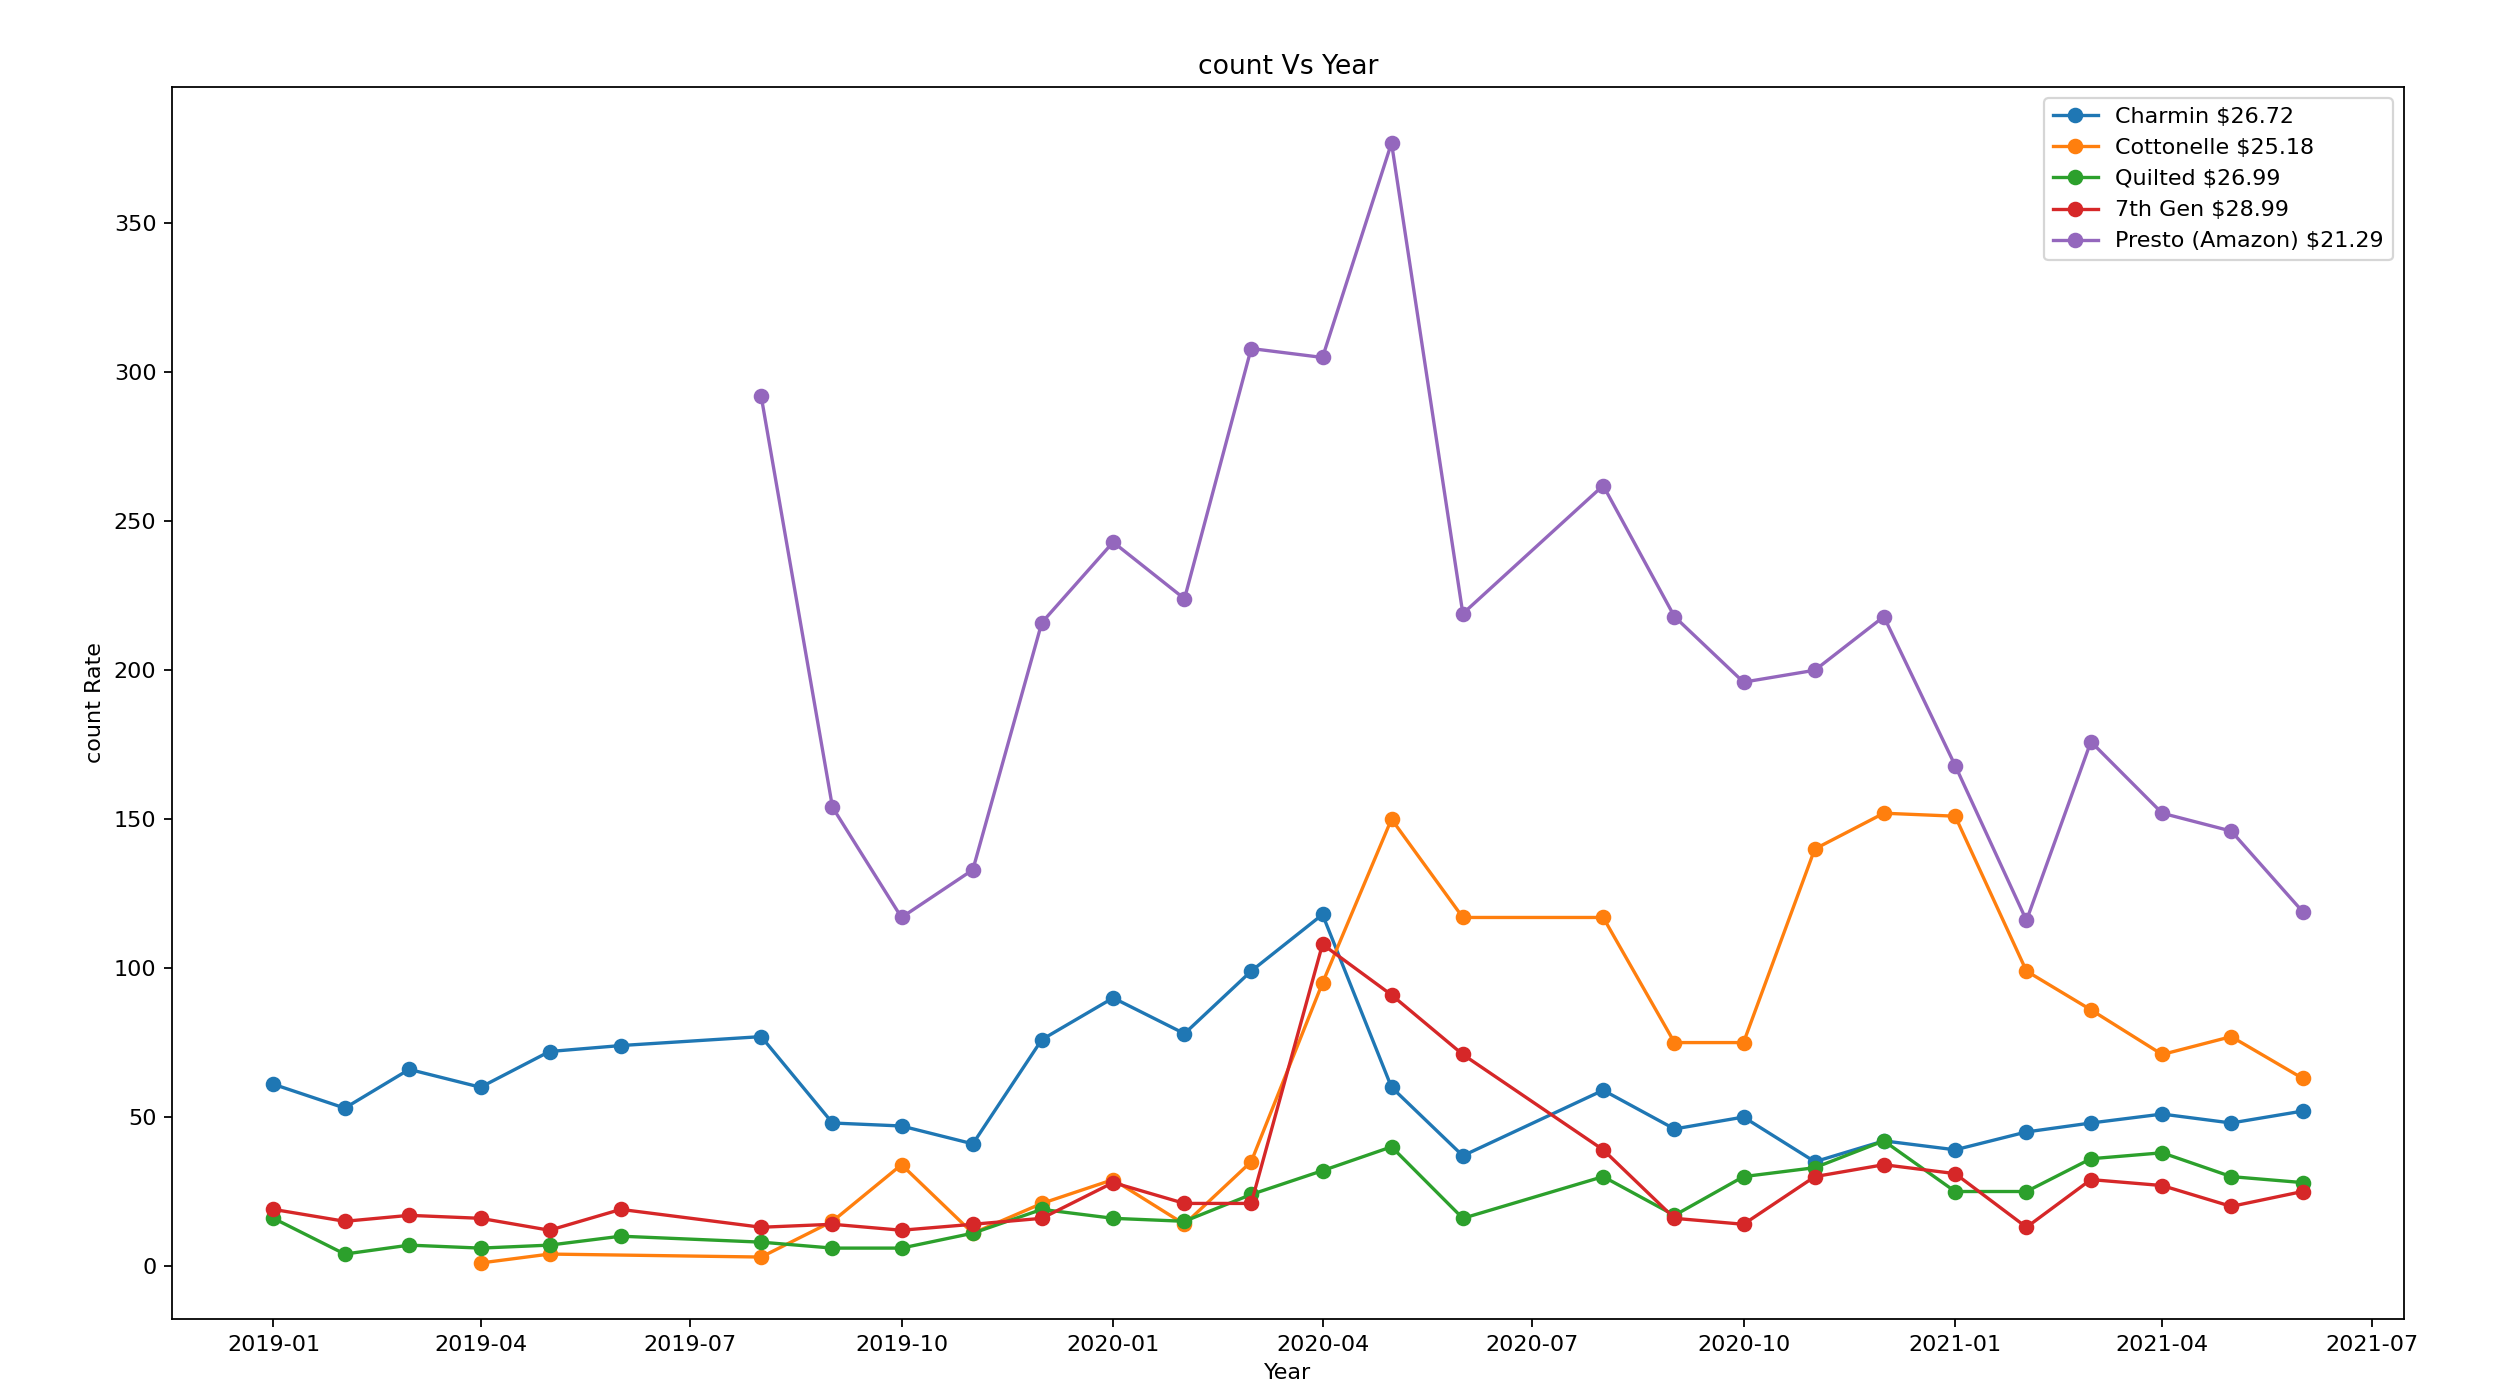
From the above plot, we learn that:
- There is a larger pattern here which is likely dependent on promotions and ad spend on Amazon
- Toilet paper sales were likely higher than average for a year after the Covid 19 pandemic began to spread.
- From the difference in the review counts pre month, we learn that online sales for these FMCG goods is likely lower than sales for consumer electronics.
Further Possibilities
We’ve only scratched the surface. With reviews and ratings data, one can learn a lot about brands and their audiences:
- Sales trend
- Customer sentiment
- Competitive performance
If you suspect that some products might have a lot of fake reviews, you can choose to only plot the 1-3 star reviews since they might be a truer indicator of sale volume.
Extracting Relevant Data
How can you get ratings & review data for a category of your interest? We used our online reviews API to generate the datasets used for the above analysis.
You can get ratings and review data by scraping the web since this data is public.
Unwrangle offers real-time data apis that help scrape data from amazon or scrape reviews from yelp quickly and reliably. View entire list of scraping APIs.
Along with reviews, our e-commerce Data Feeds also include pricing information and other useful meta data.
Resources & Sample Datasets
We would like to share the resources we used to write this blog post. Here’s a link to the script used to plot the above graphs. It generates the review count vs. month plot using the response files generated by using our Online Reviews API.
The online reviews datasets used by us are available for download at the bottom of this page.
Lastly, if you want to find trends on Amazon and other e-commerce sites to help your brand succeed. Sign up for a free trial of Unwrangle and extract up to 10,000 online reviews for free. Use the script linked above to learn about the trends of different products.
We also have a new API product that can extract each reviewer’s past purchases, contact us to learn how to use it (documentation is coming soon). You can learn a lot about your target audience using public data. And it’s our mission to make this public data accessible.
Download Dataset